Exploration & description/Numbers of rainy days |
||
|
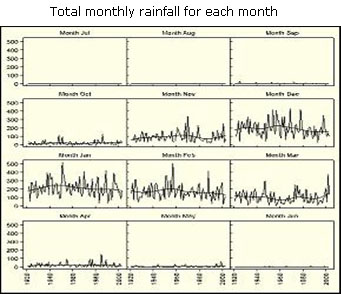
If there is a change in annual seasonal rainfall it is important to know whether there has been any change in the time when the rainy season starts. Thus, we use trellis plots to look at the patterns in average daily rainfall totals and numbers of rainy days for each month. Any signs of curvature are investigated by regression analysis. (GenStat was used as trellis plots and spline smoothing were not yet available in INSTAT). |
||
|
|
 |
|
![]()
![]()
![]()